3DNature

3D Landscape Design & Visualization Software published and supported by AlphaPixel

Menu

Real World Uses

World Construction Set and Visual Nature Studio in the Real World

WCS and VNS images and animations are everywhere: on network television, at the movies, in newspapers and magazines, at major architectural and engineering project presentations, in natural resource and forestry visualizations, in hit video games and simulations and at universities around the world. Here are a few examples professionals and artists have shared with us.

California Wildfire Visualization for the Institute for Business and Home Safety

In October 2007 3D Nature created a three-minute 3D visualization of the damaging Witch Creek Wildfire that burned for 10 days in San Diego County, California.

Working on a tight budget and deadline under contract with the Institute for Business & Home Safety, 3D Nature recreated the affected areas in Visual Nature Studio, modeling terrain, roads, vegetation and houses. An informative voice-over explained the factors underlying the survival or destruction of various homes as the viewer witnessed firsthand the effects of the fire.

“Wildfires are called wild for a reason, they can be uncontrollable,” said IBHS President & CEO Julie Rochman. “Through the video we were able to help people understand that they can take back control by protecting their homes from these fires. We were able to illustrate that it doesn’t have to cost a lot to make some very effective changes.”

Copies of the video were distributed to news media at press conferences in Sacramento and San Diego, and the video was shown during a presentation at the Benfield Group’s West Coast Catastrophe Summit in Santa Monica. Media outlets replayed segments from the video during nightly newscasts. Watch the video in our Animation Gallery and read the accompanying IBHS report at https://disastersafety.org/ibhs/megafires/.

Click any image for larger version.

Hurricane Ike Storm Surge Visualization, September 12, 2008

Hurricane Ike’s path is predicted to match Rita’s path. At the time of Rita 3D Nature created a series of images to show how the storm surge might impact the city of Galveston, Texas. Those same images apply to Ike as well.

Hurricane Rita information:

This animation was created to show the prediction of water level in Galveston, Texas, assuming a storm surge of up to 20 feet. Terrain data was 1/3rd arc-second NED DEM. Imagery was 30-m Landsat, processed with PixelSense LS combined with 1-m Color Infrared DOQQ, processed with PixelSense CIR. The NED terrain surface is made from contour maps, and does NOT include building heights, so it is not indicative of how much the buildings themselves would be submerged.

The compass rose in the upper right corner indicates North. The Water Level graph on the left indicates water level in feet, from 0 (normal sea level) to a maximum height of 20 ft of storm surge. Surge height greater than 20 ft was not simulated, because the maximum terrain height on the island is less than 20 ft.


This animation is available for use, royalty-free by all news media, as long as you credit 3DNature.com and send us a message telling us where the animation was used.

2010 Olympics Games Highway Upgrades

These images are for the Sea to Sky Highway upgrade from Vancouver to Whistler, Canada. This project was needed to carry traffic for the 2010 Winter Olympics.

Wetlands Center Proposal

Screenshot from a Nature View project depicting a proposed wetland center in New Zealand.

Note not all the buildings were modeled by the client, hence the ‘grey blocks’.

Karakorum Ridge, K2

This image was put together after a request from an Italian climbers association. In 2004 this group completed a commemorative trail in Karakorum, to celebrate the 50th anniversary of the first climbing in the world of K2. This first successful climb was completed by an Italian expedition in 1954, guided by the famous geologist Ardito Desio and composed of important and strong climbers like Walter Bonatti, Achille Compagnoni and Lino Lacedelli. The last two gained the summit of K2 on July 31st 1954.

3D Nature Completes Powerline Right of Way Visualization for National Parks Service

3D Nature completed a series of visualizations of the Upper Delaware Scenic and Recreational River under contract to the National Parks Service and The Upper Delaware Scenic Byway (New York State Route 97).

The visualizations concerned the placement and visual impact of New York Regional Interconnect’s 190-mile long high voltage direct current (HVDC) transmission line from Oneida County, New York to Orange County, New York. Using reference photos and GIS data of terrain and vegetation, 3D Nature created accurate 3D images of the proposed alignment to illustrate the position and visibility of the powerline towers from critical viewpoints. Paired photorealistic images and matching reference “guide” images (containing only brightly-colored towers on a neutral featureless terrain) help stakeholders locate and analyze the visual impact within the context of familiar locations.

More info about 3D Nature’s Services is available here.

VNS Brings Space Data to Life in Mountains From Space Book

These images are taken from the 2006 book Mountains from Space.

“Never before have humans had a sharper image of planet earth. A fleet of modern remote sensing satellites is constantly monitoring the earth’s surface and is gathering invaluable geo-data that helps to understand our environment and to improve our quality of life. Beyond the usual information provided by satellites for scientists, the images taken from space also unveil the glittering beauty of our planet. Aiming at the broad public we intend to show the artistic side of our scientific work at the German Aerospace Centre. Visual Nature Studio is helping us bridge the gap between the rapidly evolving field of remote sensing research and our non-scientific audience. VNS’s ability to handle huge geographical data sets in various projections and to bring them into artistically appealing perspective views is unique.” said Nils Sparwasser, one of the artists involved in the book.

Genesee Dam Lower Alternative, Plan

3D Nature contributed pro-bono 3D visualization and testimony in opposition to the Genesee Water District’s site approval application for their Lower Alternative Site, contributing to the application’s unanimous 7-0 defeat before the Jefferson County Planning Commission.

Before the Commission, 3D Nature Vice President Chris Hanson gave sworn testimony and entered 3D visualizations into the record to show the Commission and all involved stakeholders what the proposed dam would look like. The planned structure was 120 ft tall, 500 ft long and could impound approximately 125 acre-feet of water with a 2.5-acre surface area. The visual impact of the dam, placed 600 feet from one of Colorado’s state Scenic Highways, on Open Space land and adjacent to city and county recreational parks, was one of the most contentious issues of the project. Prior to 3D Nature’s involvement neither side had commissioned extensive 3D visualization of the issue, leading to much argument over apparent size, visibility time and extent from the road and landscape scarring from access roads.

The consensus of the opposition was that while a dam and reservoir may be necessary, the criteria that drove the selection of this site were flawed and that other sites with less detrimental effects (visual and otherwise) needed to be re-evaluated.

The Jefferson County Planning Commission agreed in a unanimous 7-0 vote, noting that among other factors, the structure would be visually undesirable in ways that could not be practically mitigated. The Commission also determined that the visual aspects were contrary to the Mountain Community Master Plan, adopted in 1994, which specifically identifies the region in question as visually sensitive and marked for preservation.

3D Nature’s visualizations consisted of planimetric and north and south-looking perspective views, as well as a fully interactive Nature View Express 3D Model — all created using Visual Nature Studio 2.5. This project was created from scratch. Initial work began less than 24 hours prior to the planning meeting.

NOAA, Green Pond, Cape Cod, Massachusetts Project

The U.S. National Oceanographic and Atmospheric Administration (NOAA) contracted 3D Nature for visualization of dock and pier structures on Green Pond, Cape Cod, Massachusetts. NOAA worked with planners of the local community to develop two alternative strategies for dock and pier design to limit the impact of future construction along the waterfront.

Shellfish productivity and traditional vistas could be protected to varying degrees by applying building restrictions of differing severity. Finding the best trade-off between protection and private property rights involved public input. Also important was for people to be able to envision alternative dock designs in order to judge their functionality. To these ends four scenarios were visualized:

1. Conditions as they exist today.
2. As the waterfront would appear after full buildout under current regulations.
3. At full buildout under one set of proposed regulations.
4. At full buildout under a more restrictive set of proposed regulations.

Views from near water level and from a higher viewpoint were generated. A thirty second animation showing the view of the inlet from the deck of a passing boat was also produced.

NOAA supplied extensive documents specifying which dock designs could be used in each scenario, right down to the styles of railing to be allowed and the sizes of floats.

At the end of the day what distinguished our product was not the degree to which we adhered to their specifications, that was expected, the distinguishing element was the realism. I don’t think anyone at NOAA or the local agencies were prepared for that and they were very impressed.

Hurricane Katrina, New Orleans Water Level Animation

This animation was created to show the progression of the water level in New Orleans. Terrain data was NED DEM (made from 5m LIDAR data). Imagery was 30m Landsat, processed with PixelSense. Timeline, water height and dike height info was gathered from various sources, including the Army Corps of Engineers.

Hurricane Rita, Predicted Impact on Galveston, Texas

This animation was created to show the prediction of water level in Galveston, Texas, assuming a storm surge of up to 20 feet. Terrain data was 1/3rd arc-second NED DEM. Imagery was 30-m Landsat, processed with PixelSense LS combined with 1-m Color Infrared DOQQ, processed with PixelSense CIR. The NED terrain surface is made from contour maps, and does NOT include building heights, so it is not indicative of how much the buildings themselves would be submerged.

The compass rose in the upper right corner indicates North. The Water Level graph on the left indicates water level in feet, from 0 (normal sea level) to a maximum height of 20 ft of storm surge. Surge height greater than 20 ft was not simulated, because the maximum terrain height on the island is less than 20 ft.

Bench Project Visualization, Bighorn National Forest, Sheridan, Wyoming

Computer-aided simulation of our public lands is beneficial to ensure that management activities and constructed facilities fit well into the natural environment. On the Bighorn National Forest in north central Wyoming, insect infestation in Douglas fir has reached epidemic proportions in the scenic Shell Canyon drainage. This joint project between 3D Nature and the USDA Forest Service created visualizations for public informational meetings to clearly demonstrate to citizens how a proposed forestry project would affect the forest both now and in the future. Visual simulation of the Bench Project will allow both the public and the management agency to see into the future, both with and without forest management activities, to determine if the proposed activities are in the best interest of the public and the public lands themselves.

December 26, 2004, Tsunami Visualization

Jeff Thurston of Vector One GIS & Visualization created these images to visually depict the drastic change in water level caused by the Tsunami. These images are all based on SRTM 30 as the elevation data source.

David Fierstein Wins Science Magazine’s 2004 Visualization Challenge with WCS Image

Mount Etna came to life in a visualization created by David Fierstein for Science Magazine and the National Science Foundation’s Science Visualization Challenge 2004 Visualization Challenge.

David said, “It should be pretty obvious which parts were done with WCS — most of what’s on or above the land surface, including a lot of the volumetrics. Some of the volumetrics, and most of what’s below the land surface, were done with Lightwave, and a fair amount of Photoshop. The image originally appeared in Scientific American magazine.

“Fierstein’s graphic documents the changing nature of the volcano by combining this new evidence with prior research. The insets at the upper left illustrate how the unique geological location of the volcano allows it to produce large volumes of magma, and the panel at the lower right provides details about recent lava flows and eruptions. The central image chronicles the evolution of Mount Etna from a relatively flat shield volcano to the mountainous cone that looms over the countryside today. Fierstein says the large, glowing magma pools in this image are the most salient part of the graphic, in that they highlight Mount Etna’s hypothesized “dual plumbing system,” which may give clues to the volcano’s future activity.” said Science Magazine

To read the entire article visit the Science Magazine’s Web Site.

3D Nature Tools Used in Coastal Visualization

A local paper in Norfolk UK wrote a piece about how Tyndall Centre for Climate Change Research, based at the UEA is using 3D Nature’s products for a current coastal research project. “Technology normally seen in the latest computer games is being used by Norfolk-based scientists to help make crucial decisions about the future of the county’s coastline.”

Dr. Andy Jones said, “It (the visualizations) will give people the freedom to walk around in virtual reality and explore the effects of climate change and the impacts of various decisions that will need to be made to protect the coast.”

VNS Used to Explain Natural Feature

Rick Lovel poses next to the highway sign that features his WCS rendering.

“The sign is on highway 200, only a few miles east of Sandpoint, Idaho, an artsy little town. Schweitzer Basin Ski resort sits right above it (not a Vail, but still a world-class ski resort) and the wintertime views of the lake from atop the mountain are gorgeous. I have often sat atop the peak on my snowboard and contemplated the glacial coverage of 13,000 year ago and subsequent flood.”

VNS Used to Warn Hikers of Serious Incline on Hawaiian Trail

This image is the final product for Meeker Designs out of New York City. This will be a large 4+ foot tall warning enamel sign for a popular but very difficult trail on Oahu Hawaii.

The cross-section came from the vector to Adobe Illustrator exporter in the VNS vector editor. However, the customer insisted that it be exaggerated to warn off ill-prepared hikers. The original planimetric and perspective views submitted had more tonal range but were lightened considerably to make the trail gain dominance.

VNS 2 Used to Visualize Power Outage Source and Evolution

Jeff Thurston created these maps to show the extent of the East Coast blackout of 2003.

These maps were used by National News in Canada and the BBC to show the public what happened and how it might be avoided in the future.

VNS 2 Used to Change Neighborhood Development Plan

Pre- and post-development visualizations for proposed playing fields on open green space near my home in Bristol, Southwest UK.

The proposals suggest the leveling of a reasonably extensive piece of open green space used by many local residents, and the erection of a fence (at least 1.8 m high – approximately 6′). The visualizations show proposed fields before and after the implementation, with a fence height of 1.8 m.

VNS was invaluable in the creation of this project.

Recent developments suggest the visual impact study may have helped change some opinions on the current proposals, and further discussions are taking place. It is hoped that these preliminary “sketches” will help accelerate a more in-depth Visual Impact Analysis for the project which so far has been considered “unnecessary” by the developers.”

World Construction Set Student Wins National Cartography Contest

Rob James, a Cartography Student at University of Hawaii, created this map depicting a historical event in the Island’s history. This map won the 2003 National Geographic Society Cartography Contest.

Conquering Oahu was the last major obstacle for Kamehameha I to unify all the Hawaiian Islands under one rule. This map describes the movement of his army and the locations of battles, beginning on the island of Hawaii and concluding with the horrific Battle of Nuuanu on Oahu, where thousands of warriors died, some by being forced over the steep cliffs at the back of Nuuanu valley where they fell hundreds of feet to their death. Although this map was initially created for Rob’s own curiosity and education, visualizing history adds an inherent richness and depth to a once textual story.

Rob said, “Others whom I have shared this map with, Hawaiians and non-locals alike, learned from it; not because they have never heard of the Battle of Nuuanu, but because they have never been able to visualize the geography of the battle.”

He continued, “The base image and both insets were rendered in WCS 5.54. An Oahu DLG coastline was modified to better represent the historic coastline of Honolulu. This vector was placed over the 10 meter DEMs as an area Terraffector to control the slope of the submerged shoreline, creating the lighter near shore waters. Terrain textures were applied using elevation and slope parameters. The “After the Battle” inset used a self-made database of images of native Hawaiian plants including the kukui, ti, and hau to realistically texture the landscape. Kukui, with their light, bright green leaves, tend to grow only in the areas between ridgelines. Of course, the controls in WCS made accurately placing this ecosystem easy!”

Scientific American Magazine Forest Fire Visualization

David Fierstein’s World Construction Set 6 Forest Fire Visualization nicely complimented an article about the debate over Forest Fire Mitigation. David explains the differences in forest fire movement between an area that has had mitigation performed and one that has not.

Copyright 2002, David Fierstein

Lewis & Clark Historical Recreation

To avoid errors and confusion, 3D Nature has taken some text describing the project from the web site. All images and text are Copyright 2003, Curators of the University of Missouri

The Lewis and Clark Across Missouri website was designed to “serve geographical information and maps that are products of the LEWIS AND CLARK HISTORIC LANDSCAPE PROJECT that has been conducted at the Geographic Resources Center(GRC), Department of Geography, University of Missouri in partnership with the Missouri State Archives, Office of the Missouri Secretary of State.

With the primary goals to georeference, digitize, and map all of the retrievable information from the Lewis and Clark journals and the 18th and 19th-century land survey notes along the Big River Corridors of the state of Missouri, this effort should serve as a significant educational contribution to the national commemoration of the Lewis and Clark Bicentennial (2003-2006). Specific campsite maps, photo-realistic images of important river landmarks, animated virtual Missouri River travel, and an interactive map server offering various layers of geographical data on the Expedition’s outward and homeward journeys joined with the natural and cultural history of the Missouri River corridor are all currently offered here.”

Jim Harlan says that, “the information used to georeference the river and foliage was derived from early 18th and 19th century French and Spanish land survey documents, early 19th century U.S. General Land Office survey documents, and the notes and journals of the Lewis and Clark Expedition. The early surveyors took careful, dutiful notes about the location, size, and species of trees; as well as the general land cover (i.e. timber, prairie, barrens) along their routes which was incorporated into this project for accuracy. Lewis and Clark’s geographical observations and navigational data filled in the blanks as to the Corps of Discovery’s locations along their route up the Big Rivers”.

The Lewis and Clark Across Missouri is a valuable resource and link to many other images and interactive exhibits.

Special thanks to Jim Harlan for letting 3D Nature know about this project!

Highway Interchange Redesign Project

Mike Ostrom of CH2M Hill worked on this interchange project. An animation flying around the entire site was created in VNS.

Mike stated, “Our projects often contain data from multiple sources. In integrating terrain mapping, imagery, and vector data, we often spend valuable time and money on converting or reprojecting data for visualization. Visual Nature Studio has allowed us to integrate the source data as we get it and redirect our resources on improving overall quality of our animations. In VNS I’ve finally found a tool that will work with as many file formats and projections as I do”.

Digital terrain was created in 3DNature’s Visual Nature Studio (VNS) from USGS 30-m DEMs. USGS 7.5-min DRG foliage zones were separated from all else in Photoshop and used to drive ecosystem placement in VNS.

All Images Copyright Mike Ostrom, CH2M Hill, 2002

Arizona Forest Fire Progression Maps

Scott Cherba has developed an animation showing daily progression of the 2002 Bullock Fire in the Santa Catalina Mountains north of Tucson, Arizona. The above maps (modified from the animation) were provided as a public service. 

Digital terrain was created in 3D Nature’s Visual Nature Studio (VNS) from USGS 30-m DEMs. USGS 7.5-min DRG foliage zones were separated from all else in Photoshop and used to drive ecosystem placement in VNS.

The Bullock Fire progression maps by Humphrey’s Southwest Incident Management Team were used to create a sequence of color maps in to place fire zones in VNS.

All Images Copyright Scott Cherba 2002

VNS Maps Colorado Wildfire

Chris Hanson, 3D Nature programmer, received a fax directly from Trumbull Colorado Volunteer Fire Department (image on left) the morning of May 23, 2002. It was a map created by Infrared Interpreter “D. Strom” from the previous night’s midnight (aka 00:30) flyover. It showed areas of light spotting, heavy spotting and actual fire. He created a 3D map of the area (image on right) depicting this info. It is believed to be be both more current and possibly more accurate than the ‘official’ map previously offered to interested parties.

Red striped areas are fire (striped in original map also)
Orange dotted areas are areas of heavy spots
Yellow dotted areas are areas of light spots

The image on the left is the information that Chris received. It is a fax of a photocopy but using VNS he was able to georeference the data and place it on a 3D map of the region.

This map was posted on Pinecam, a local web site that provides information to residents and others in the area. It was the best map available to the public at the time of the fire.

VNS Featured in Eastern Daily Press

Katy Appleton, a student at University of East Anglia, supplied several VNS images to the city of Norwich assisting in the proposal for two new bridges to cross the River Wensum and the River Yare in Norwich. This proposal is being called the ‘gateway to Norwich’ and will be a very large project when it is approved. Katy submitted 8 images that visualized the bridges and the paths that they would connect. The images show proposals of a Vertical Lift bridge, a Fixed bridge and a Swing Bridge. This article is featured in the February 15, 2002 newspaper. All 8 images that are included were created in VNS.

These images are also featured in the Norwich City Council public approval and feasibility statement in a large four color fold out map. This map shows the actual area as well as the viewing points of where these images are taken. The images are very realistic with great detail of the area and people walking and biking on the trails.

Rapid Response Visualization with Visual Nature Studio

When time is of the essence, VNS’s streamlined workflow helps you gather, integrate and present geospatial information quickly and easily.

The staff of 3D Nature wishes to extend our sincerest condolences to those who have been affected by this tragedy. Our thoughts and prayers are with all associated with this event.

To make this rendering of the Pentagon, three different data sources were combined. A 30-m SDTS DEM of the area in a UTM system was obtained and imported through the Import Wizard. VNS automatically loaded and placed the terrain data. Next, a USGS scanned topographic map (DRG) was downloaded in GeoTIFF format and added via the Image Object Library. VNS read the coordinates in the GeoTIFF and automatically referenced the image. Finally, an OrbImage panchromatic airphoto was purchased from TerraServer.com and added to the project. TerraServer did not provide metadata or registration coordinates, so these were hand estimated by reading coordinates from the similar features found on the DRG. Had proper metadata been available, this step could have been skipped. Finally, to create the actual building, VNS’s new Walls feature was used. From the draped imagery, an outline of the building was hand-traced. Had a building silhouette been conveniently available in a GIS database, this step could have been skipped. This outline was attached to a Wall component set to create 50-m (an exaggerated estimate) walls, with roof. A simple suitable texture was created for the sides of the building, and the roof was textured with the same airphoto coloring the ground.

Elapsed render time: 30 seconds. Data Sources: 30-m SDTS DEM GISDataDepot.com free Panchromatic orthophoto TerraServer.com, $25 USGS DRG GISDataDepot.com, free.

WCS shows the Inauguration Parade Route through Washington, D.C.

Stennis Space Center had the privilege of using World Construction Set to create an animation to show the Inauguration Parade route for President Bush. The route went through Washington D.C. and on to the White House. The animation was aired on the NBC Nightly news on Inauguration Day.

The first view comes in over the Washington Monument and reflecting pool, down the mall, and to the front of the Capitol. The second part of the animation goes from the Capitol to the White House and has the parade route digitized in yellow. Each animation had over 1500 frames.

Below is an image taken from the end of the first animation.

Images are created entirely with World Construction Set. Copyright 2001, Stennis Space Center.

WCS Images used in new Science-Fiction, Fantasy Book

EDGE Science Fiction and Fantasy Publishing has recently released a new book called “LYSKARION: The Song of the Wind”. It is a part of the chronicles of the Karionin, written by Janice A. Cullum.

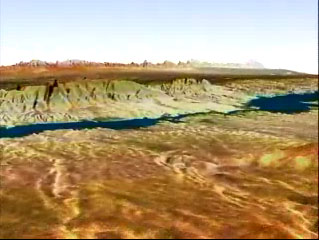
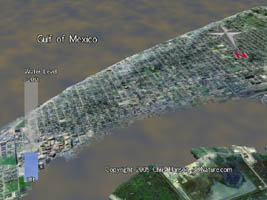
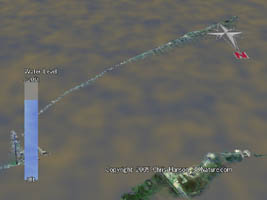
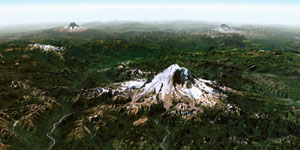
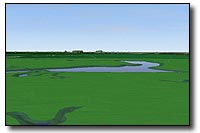
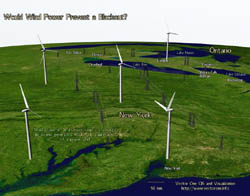
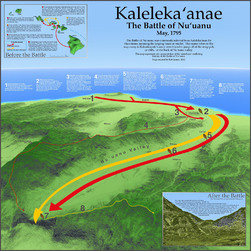
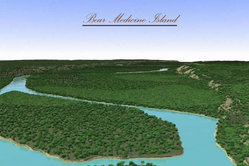
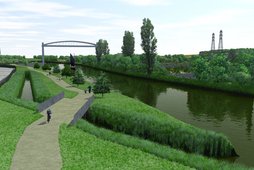
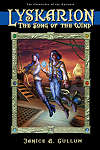
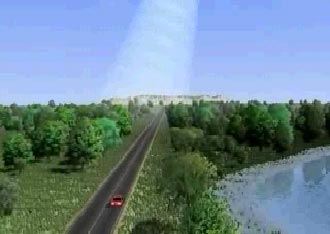
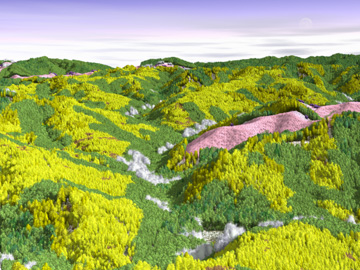
Janice Hodghead used Version 2 of World Construction Set to create the maps used to explain the location of this fantasy world.

XM Radio and Crosspoint visualize CES with WCS

XM Radio called upon Crosspoint, Colorado’s premiere post production facility, to show attendees at the 2001 Consumer Electronics Show how their new satellite radio system worked in urban and rural areas. Crosspoint turned to World Construction Set to build an outdoor environment exactly to specifications. Working with Lightwave 6 and WCS 5, Crosspoint put together this animation to air on the huge HDTV displays in XMRadio’s CES booth.

XM has taken top honors in two major award competitions at the 2001 International Consumer Electronics show in Las Vegas.

To see a portion of the animation click here.

WCS and Bureau of Land Management (BLM) Win Honors At ESRI 2000 Users Conference


The Bureau of Land Management Oregon State Office won third place in the “Best Software Integration” Category with a Poster presentation entitled “Visualizing Forest Landscapes in the Upper Smith River Watershed, Oregon Using Arc/Grid and World Construction Set (WCS).” The Poster display and WCS renderings were created by Senior Technical Specialist Jeffery S. Nighbert, with forestry rules and practices provided by Duane Dippon and Gary Passow. Below is the abstract and sample image from this poster (the actual poster was 48″ x 36″so a single lo-res image was provided here):

Title of Poster:

Visualizing Forest Landscapes in the Upper Smith River Watershed, Oregon Using Arc/Grid and World Construction Set (WCS)

Primary Authors: Jeffery S. Nighbert, Duane Dippon, Gary Passow

Email:
Fax: 503-952-6419
Phone: 503-952-6399

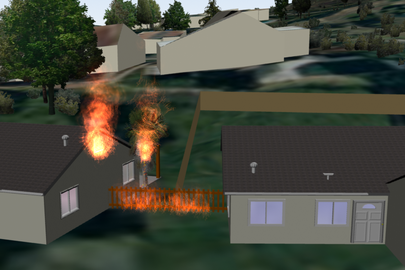
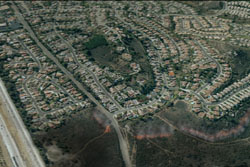
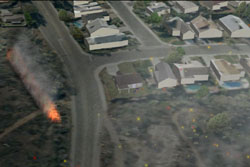
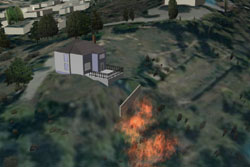
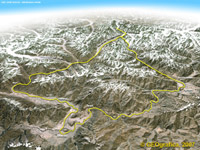
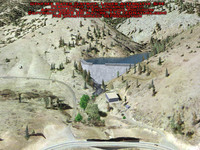
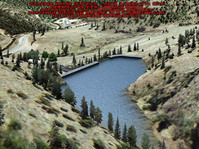
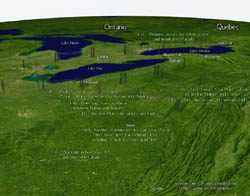
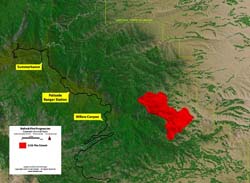
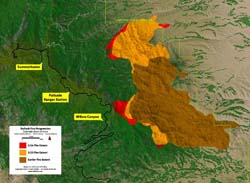
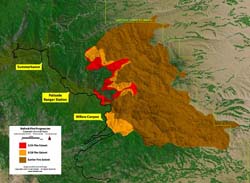
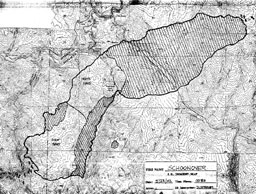
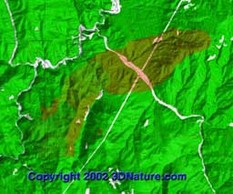
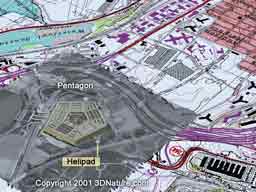
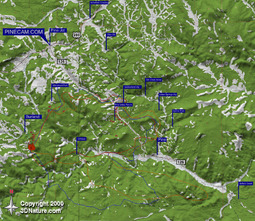
Colorado High Meadow Fire (2000)

Legend

Fire Boundaries:
 Red: 6/13/2000
 Orange: 6/14/2000
 Blue: 6/15/2000
Blue Flags: Significant habitated areas
House Symbols: Structures reported destroyed.
Flame Icon: Alleged start of fire.

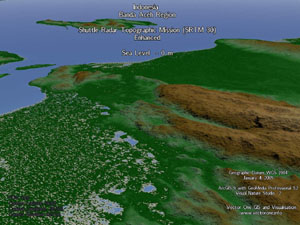
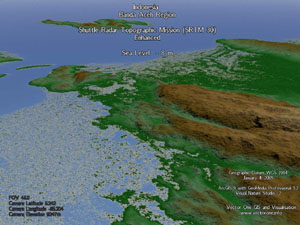
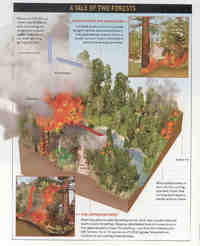
The High Meadow Fire near Bailey/Pine, Colorado burned over 10,000 acres and was exstinguished June 23, 2000. Many 3D Nature staff and family live near the fire area. In the interest of collecting the most accurate information in one place, we decided to contribute our skills, software and knowledge to creating the definitive map of the fire situation. We sought to include all verifiable sources of data, and keep it as accurate and up-to-date as possible.

Other sites that relied on the 3D Nature High Meadows basemap included:
www.pinecam.com
Denver Rocky Mountain News

WCS Assists Space Shuttle Mission

WCS Visualizes Space Shuttle Data Copyright 2000 Robert Meisner, German Aerospace Center.

NASA’s Radar Topography Space Shuttle mission has accurately mapped a majority of the Earth’s surface, gathering a bonanza of data that World Construction Set artists and scientists will be able to use for generations to come. The German Aerospace Center collaborated on the sensing equipment which worked flawlessly to gather detailed 3D data of our planet.

During the February 2000 mission they produced quick World Construction Set animations daily to visualize the data. They will continue to use the data to produce photorealistic World Construction Set images and animations of the Earth, complete with vegetation and other details. Some of the data from this mission will be available to the public from NASA in the year 2001.

WCS Shows the Way for LA Marathon

WCS sets the scene in this commemorative map for the year 2000 Los Angeles Marathon. The large-format wall poster was created by David Osti at 34 North and is available from 1-888-388-maps.

WCS Sets Scene for MiraMax Film

WCS backgrounds set the scene for "The Cider House Rules". Copyright 1999 MiraMax Films.

In the 1999 movie from MiraMax Films, “The Cider House Rules,” it was necessary to create a place that doesn’t really exist and make it completely believable. World Construction Set was chosen to bring the director’s vision to life. As the film progresses, the WCS backgrounds show the passage of time in the rolling New England hills. The WCS scenes are combined with live action in this dramatic film.

“The Cider House Rules” has received seven Oscar nominations, including Best Picture, Art Direction, Directing, Film Editing, Original Score, Supporting Actor and Screenplay.

Matte separation and compositing were done by Al Magliochetti at Eye Candy. Artist Dwayne Jensen also worked on the World Construction Set scenes.

WCS Stars on HBO

The letters "HBO" appear in a variety of objects as the camera races through the landscape. Copyright 1999 HBO.

World Construction Set is now starring on the Home Box Office network. HBO needed a new high-end animation to introduce feature film presentations. The challenge was to create a thrilling introduction worthy of being one of the most-watched animations on the planet.

The project was produced by Computer Cafe who turned to World Construction Set and LightWave 3D to accomplish the dramatic look the network desired. As the leading software for animating realistic places, WCS was the natural choice for providing the real-world context. The animation takes the viewer on an exciting journey from a modern city through a variety of scenic environments and into a futuristic cityscape.

HBO chose the showing of “Saving Private Ryan” to debut the new animation. Check out WCS on HBO!

Scroll to top